.png)
.png)

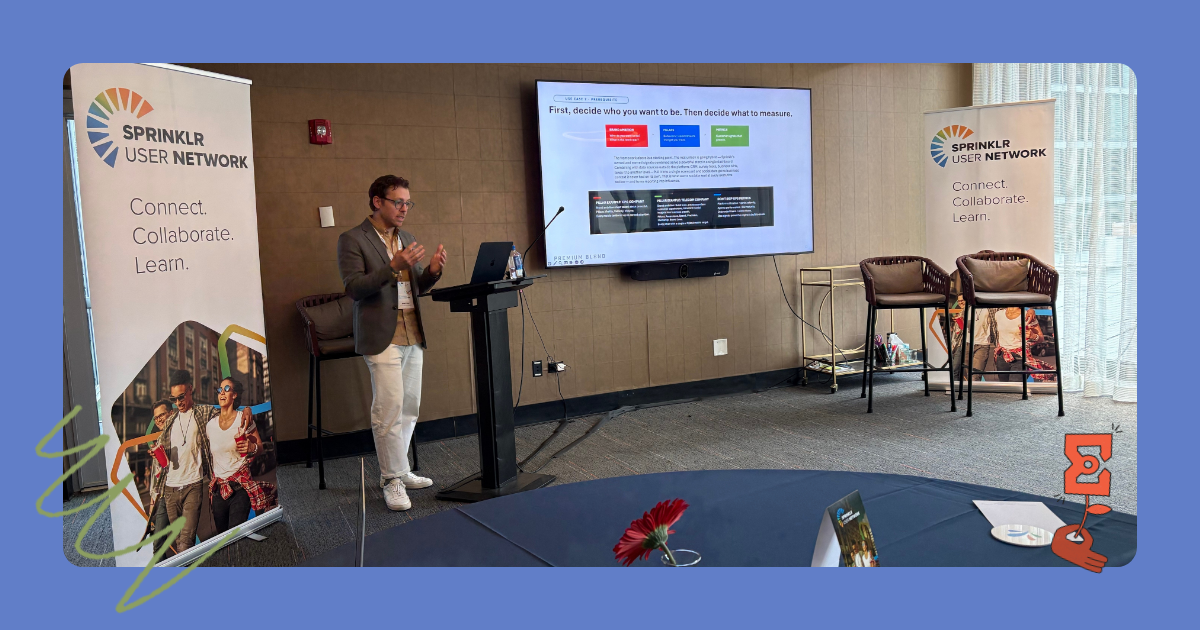
If you have ever built a dashboard, sent it out, and watched it disappear into an inbox no one opens, you are not alone. At Sprinklr's User Network (SUN) event in Chicago last month, Premium Blend Managing Director Jared Petsy put a name to that frustration during his Partner Spotlight session: it is not a data problem, it is an attention problem.
The room backed him up. A live poll of attendees rated their organization's maturity in turning Sprinklr data into business decisions at an average of 3.5 out of 5, on a scale running from "reports exist, nobody reads them" to "insight drives action weekly." That is the uncomfortable middle ground where most Sprinklr programs live: producing more data than ever, while struggling to get anyone to act on it.
This post breaks down the framework Jared shared for closing that gap, the three real-world use cases that illustrate it, and the audience data from the room that confirms why most reporting efforts stall before they ever reach a decision-maker.
Most Sprinklr instances generate insight constantly: listening signals, engagement trends, care performance metrics. The volume is not the issue. The issue is that reports get built because someone asked for them once, and then they sit unread.
There is research that backs this up. A PHD Media study of 1,721 senior global marketers found that reporting-related tasks among marketing organizations grew 57 percent over the past decade, while marketers estimated they spend just 18 percent of their time on creative thinking (PHD Media, Campaign US). Reporting has quietly become one of the biggest time sinks in marketing, often without a proportional increase in action taken from that reporting.
Premium Blend’s framing: this is not a Sprinklr problem or even a reporting-tool problem. It is a design problem. Reports tend to get built for the person who builds them, not the person who has to read and act on them. Designing for the reader, not the analyst, changes everything downstream.
Before walking through the framework, Jared polled the audience live. The results give a useful gut check for any team running a Sprinklr program.
Maturity self-assessment (24 respondents):
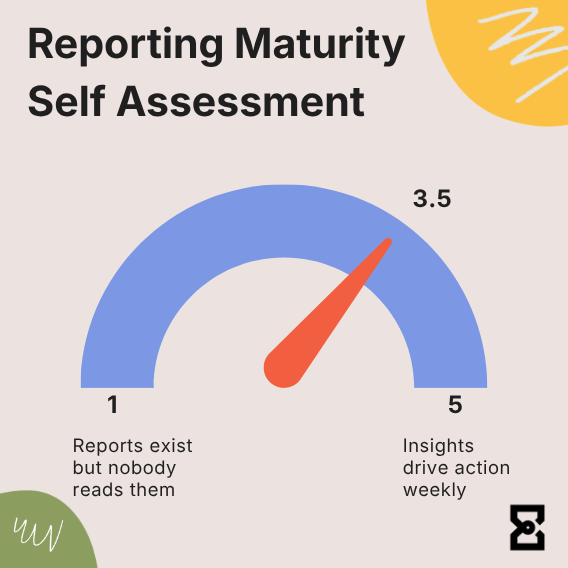
Average score of 3.5 out of 5, where 1 meant reports exist but nobody reads them and 5 meant insight drives action weekly. Most rooms full of experienced Sprinklr users will land in this same middle zone. There is no shame in a 3.5. The point is recognizing there is room to move up that scale, and that the path up is a design and distribution problem, not a "more dashboards" problem.
Why reports go unread (22 respondents, single biggest reason selected):
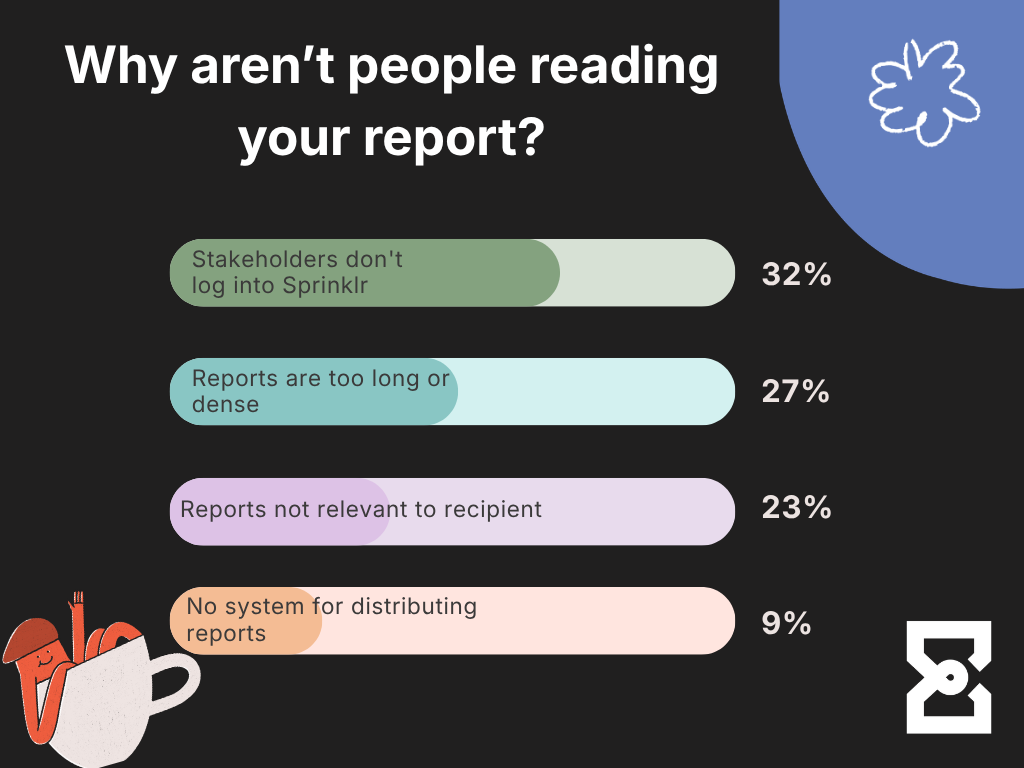
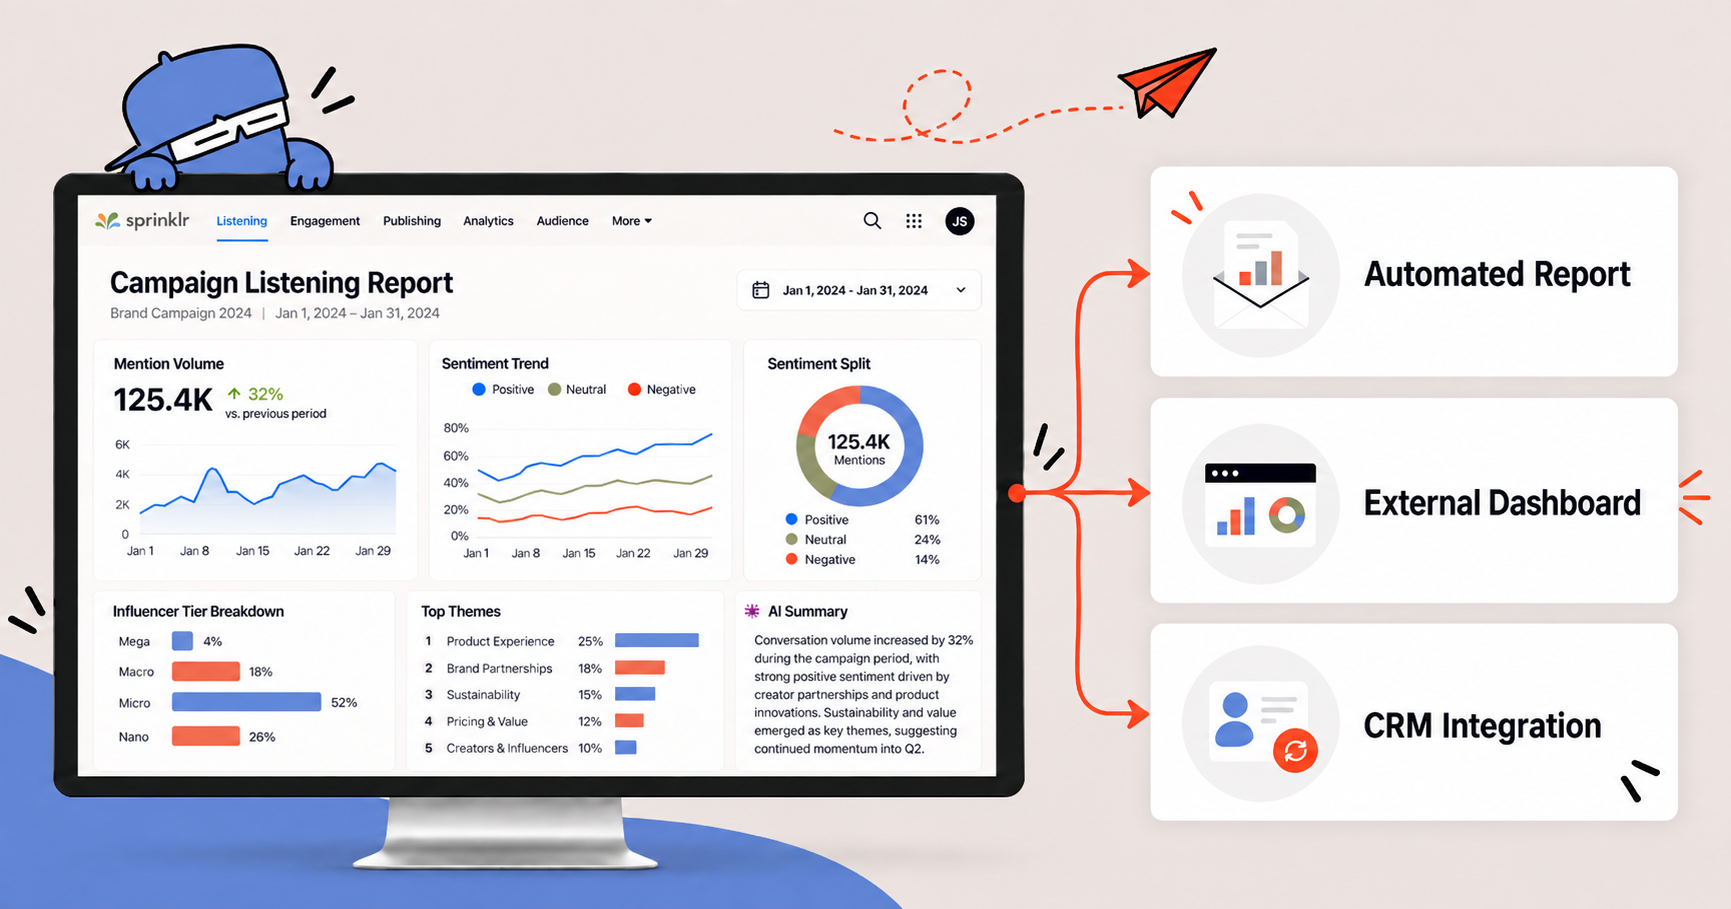
That top answer of stakeholders not logging into Sprinklr (32% of the vote) is the headline. The biggest barrier to action is not the quality of the data or even how it looks. It is that the people who need it are not in the platform at all, and the report never finds a way to them. If your stakeholders are store managers, executives, or care supervisors who live in Salesforce or their inbox rather than Sprinklr, no amount of dashboard polish will close that gap. You have to change where the insight lives, not just how it looks, which we'll cover in part 2 of this series.
To fix the attention problem, Premium Blend uses a seven-step rubric that every report or dashboard should be able to answer before it gets built:
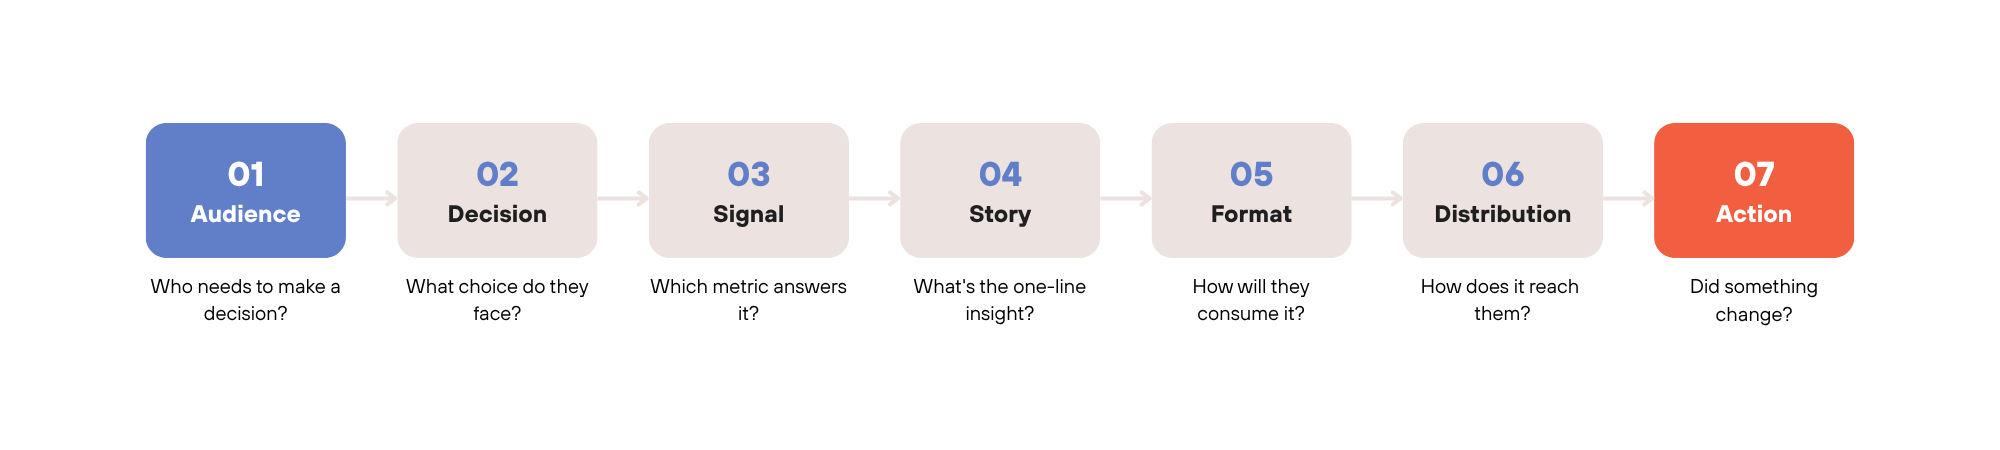
Most programs do not break down on the data side. They break down in steps one through four, because nobody defined the audience or the decision before someone started building widgets. A good report is not a collection of widgets. It is a structured answer to a specific business question, built for a specific person who has to act on it.
Knowing the framework is step one. The harder question is what it looks like in practice, at different levels of technical complexity, across stakeholders who may never open Sprinklr at all.
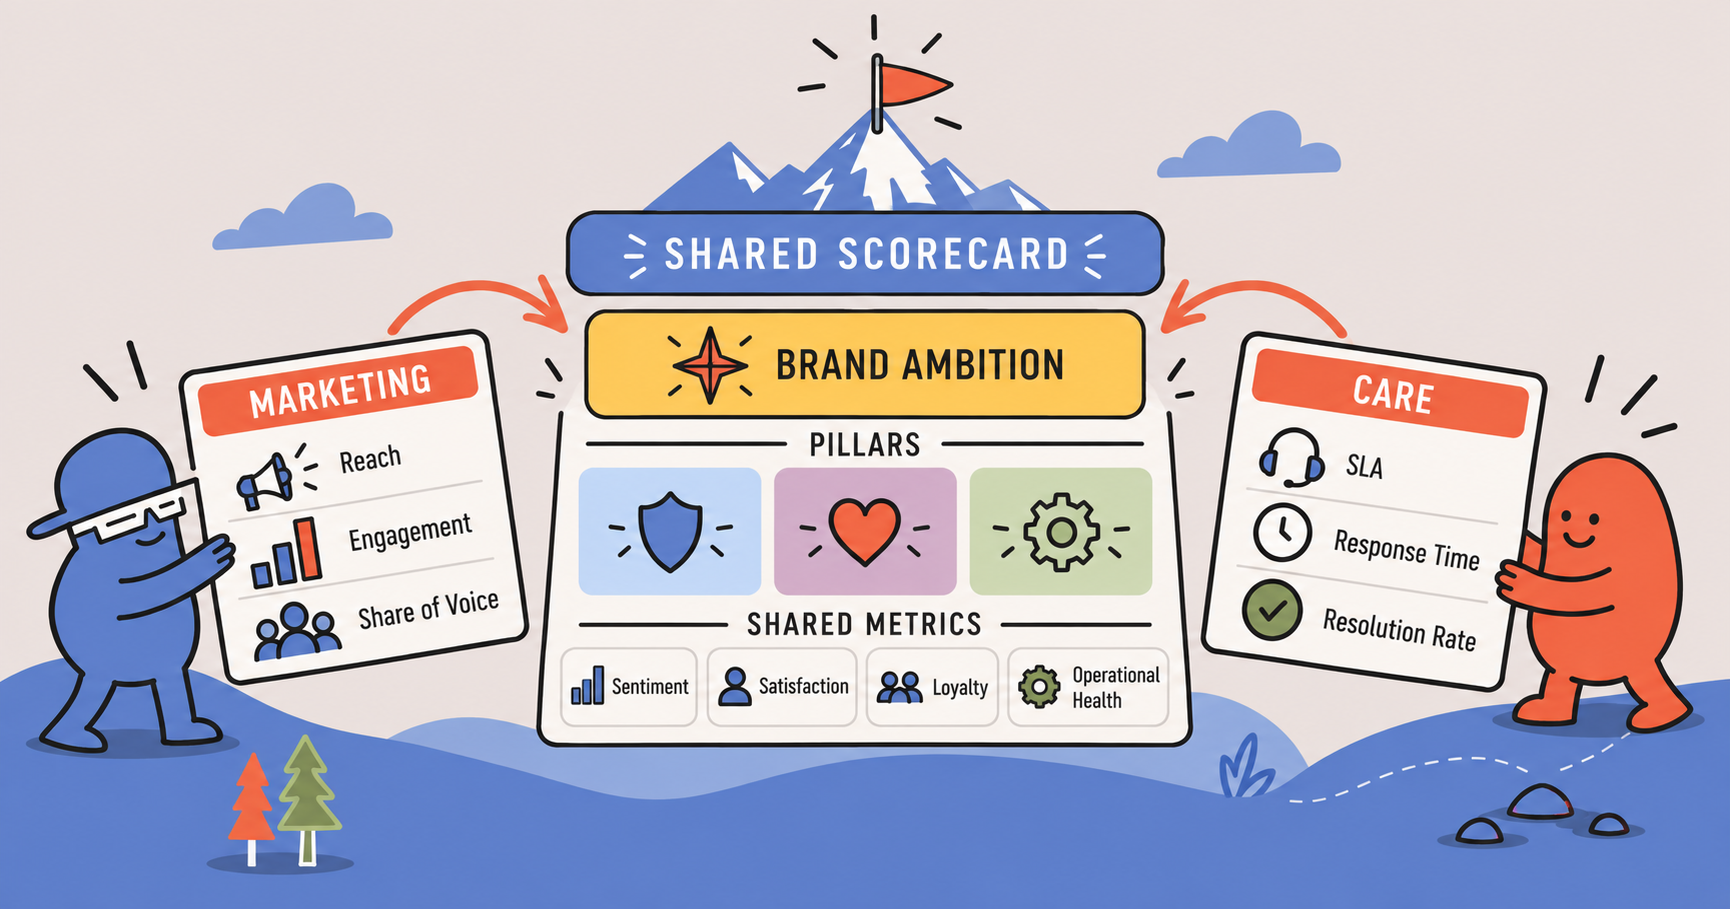
Tune in next week as we walk through two use cases from Jared's SUN session that show exactly that: one focused on getting insight to people who will never log into the platform, and one focused on building the kind of shared metrics that finally give social data a seat at the executive table. Both are grounded in real client work, and both are more achievable than they might sound.
Stay tuned for Part 2 as we dive into concrete examples of how to overcome the data distribution problem.