.png)
.png)

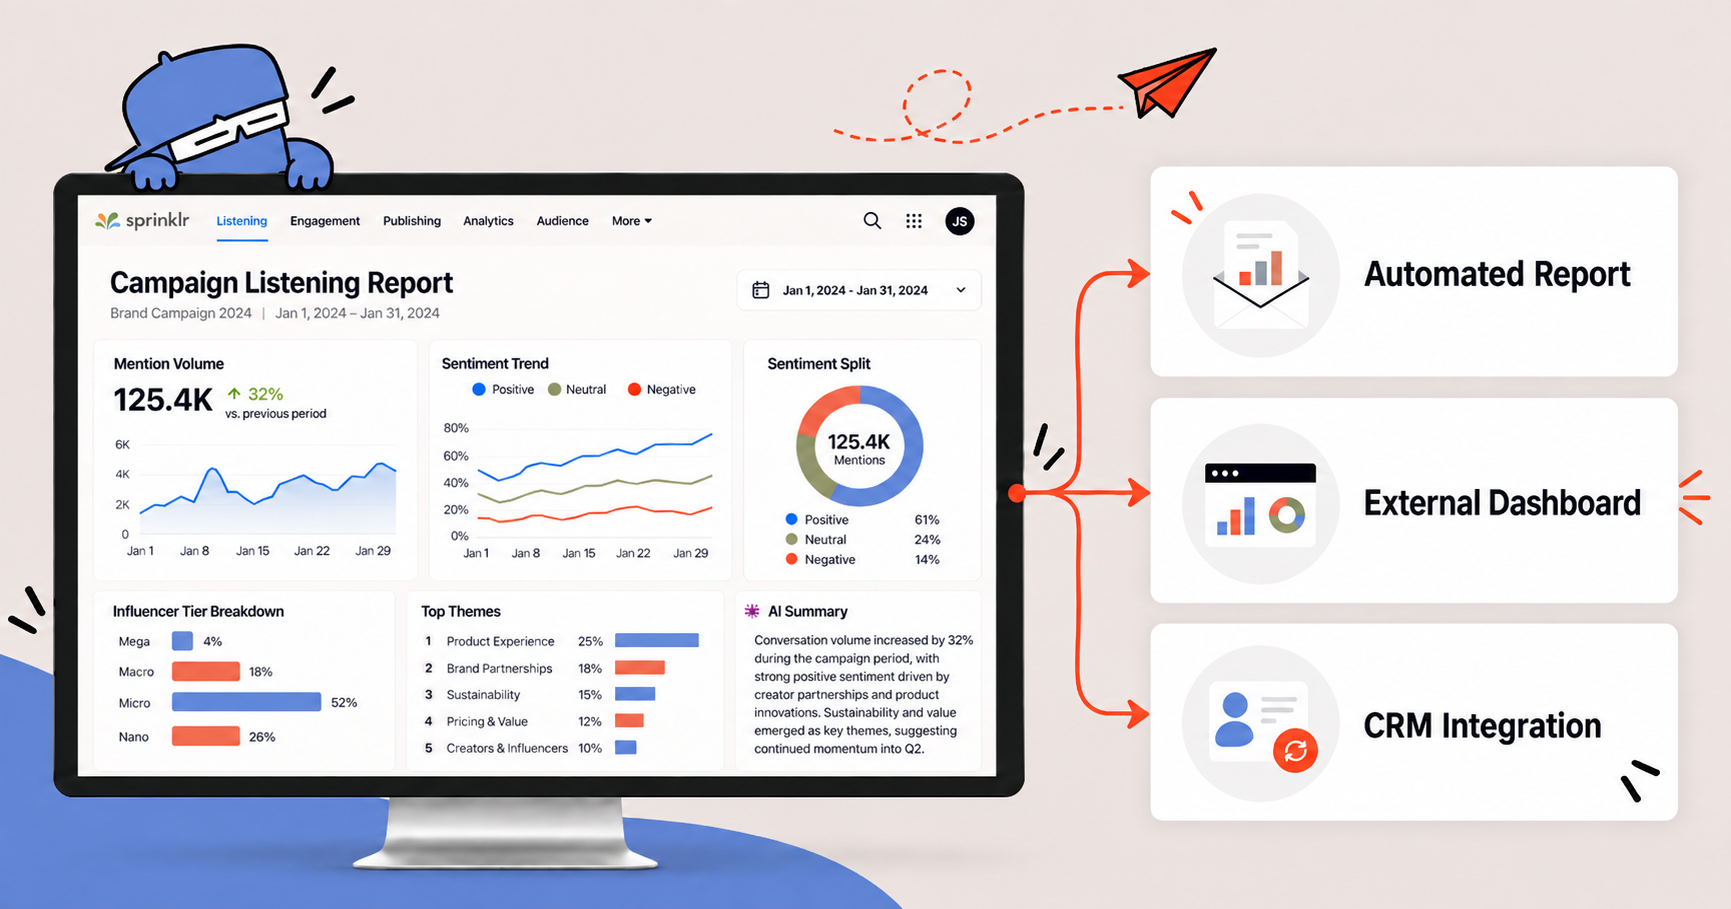
In our last blog, we tackled a reality every Sprinklr program eventually hits: many of the people who need your data will never log into the platform. We laid out a three-level delivery spectrum, from automated reports that land straight in an inbox, to live external dashboards, to insight built directly into tools like Salesforce, each suited to a different kind of stakeholder.
We also walked through how that spectrum plays out in practice: an automated influencer-tracking report that runs itself once it's built, and a crisis-ready dashboard designed to answer an executive's questions before they even have to ask.
If you missed Part 2, [catch it here before reading on].
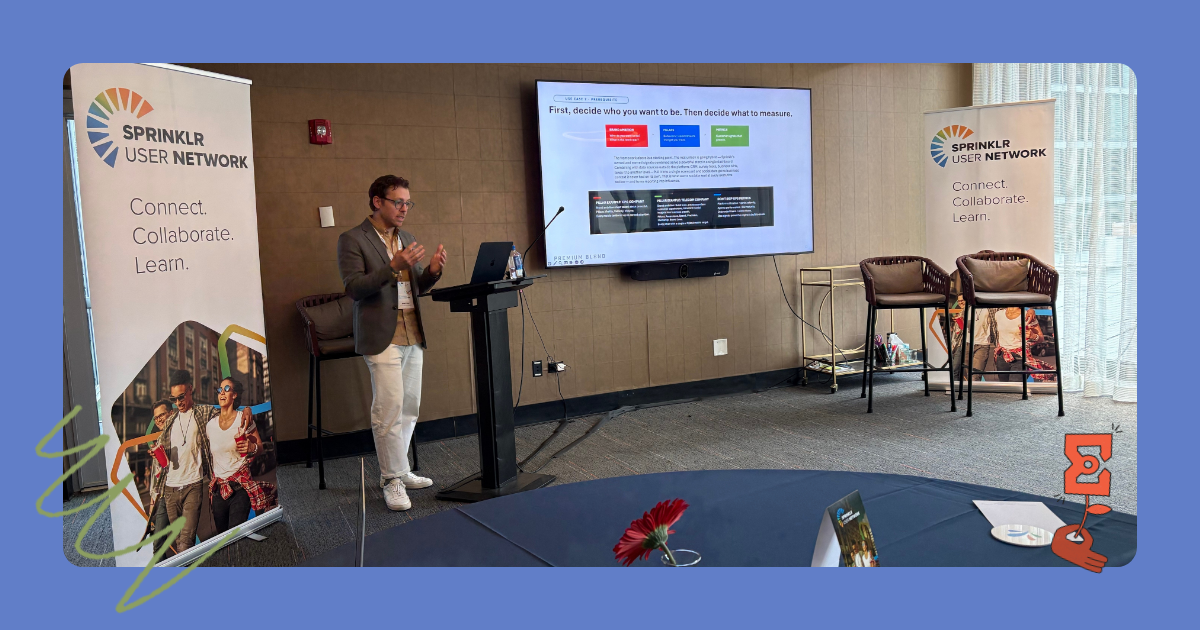
This week, we are closing out the series with the part of Jared's SUN Chicago session that ties it all together: what happens once the right data reaches the right person, and how Premium Blend helps marketing and care teams build a shared scorecard so social data finally earns a seat at the executive table.
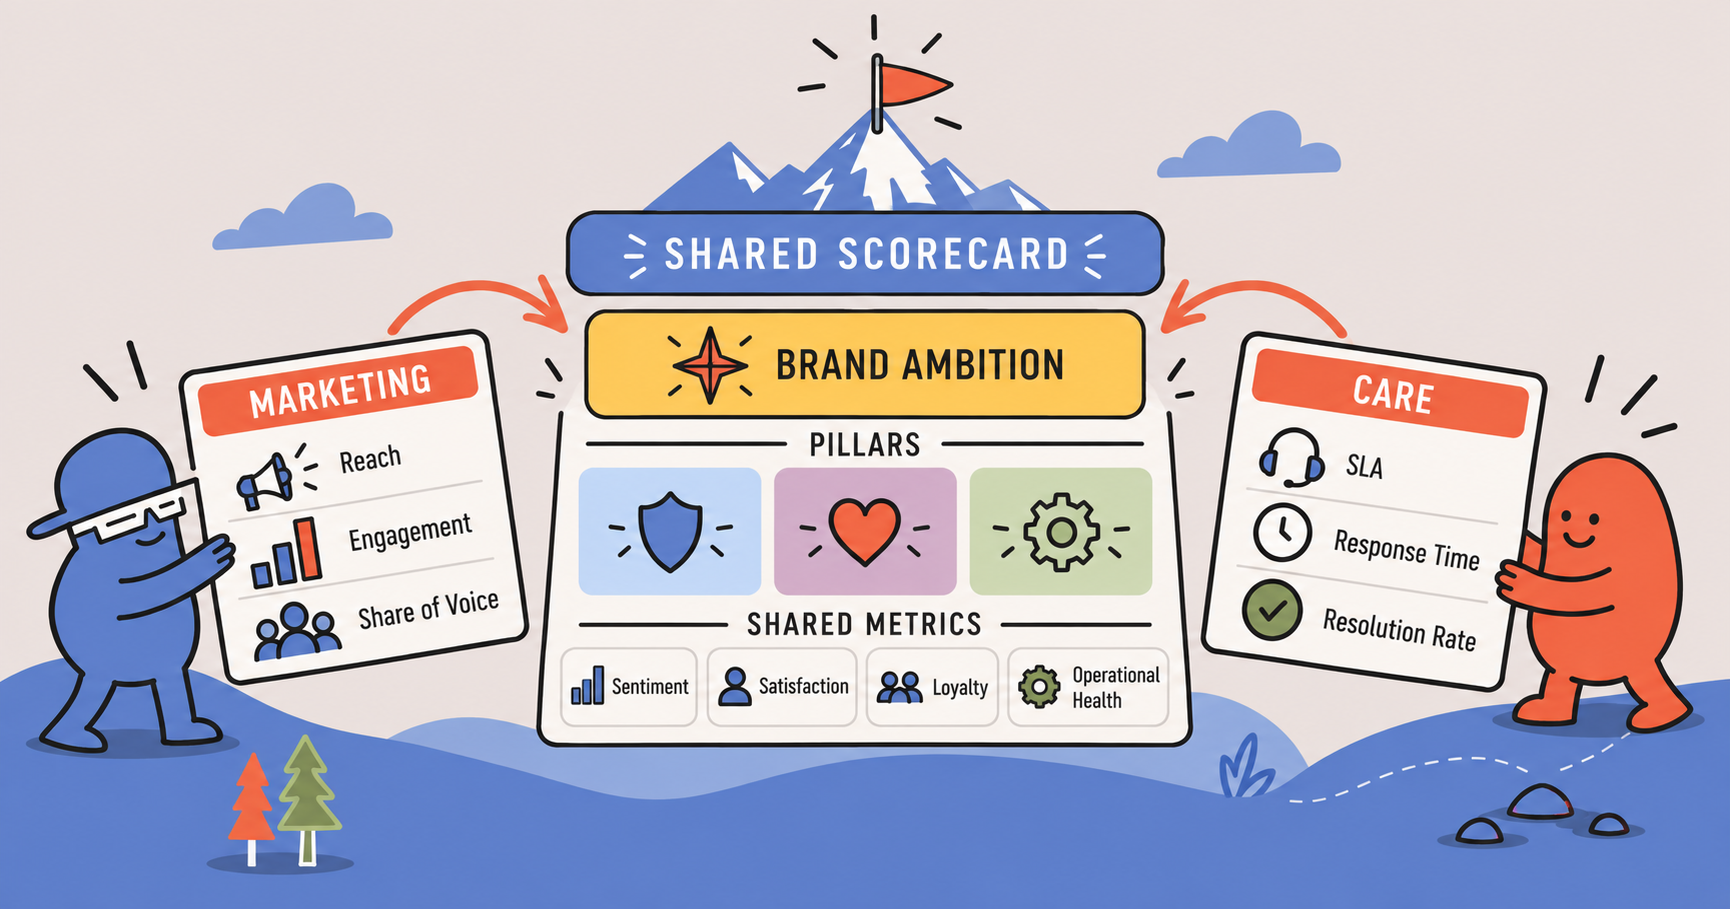
The second use case addresses a more organizational problem: care teams and marketing teams typically run on two completely different scorecards, with zero shared signal between them. Care optimizes for efficiency (SLA, resolution rate, cost per contact). Marketing optimizes for reach (share of voice, engagement, conversions). Neither team is wrong, but when these two worlds never share a metric, social data stays siloed and never becomes a business-level indicator that leadership pays attention to.
The fix is not more data. It is finding a layer of metrics both teams can own together: trust, satisfaction, loyalty, sentiment, and operational health. Sprinklr sits at the intersection of care conversations and marketing signals, which makes it uniquely positioned to surface that shared layer. This is the shift from social being "the team that makes the reports" to social being the real-time function that tells the business whether the brand is actually working.
Before building any shared scorecard, Premium Blend recommends answering one question first: who do you want to be as a brand? That single question cascades into a three-step framework:

Two real examples bring this to life. A CPG company aiming to be the most talked-about brand on social built its pillars around virality, velocity, and volume, with every metric laddering up to earned attention. A major telecom company took marketing's and care's separate ambitions and workshopped them into one combined north star as part of a broader rules-of-engagement and governance exercise, giving both teams shared accountability without changing either team's day-to-day remit.
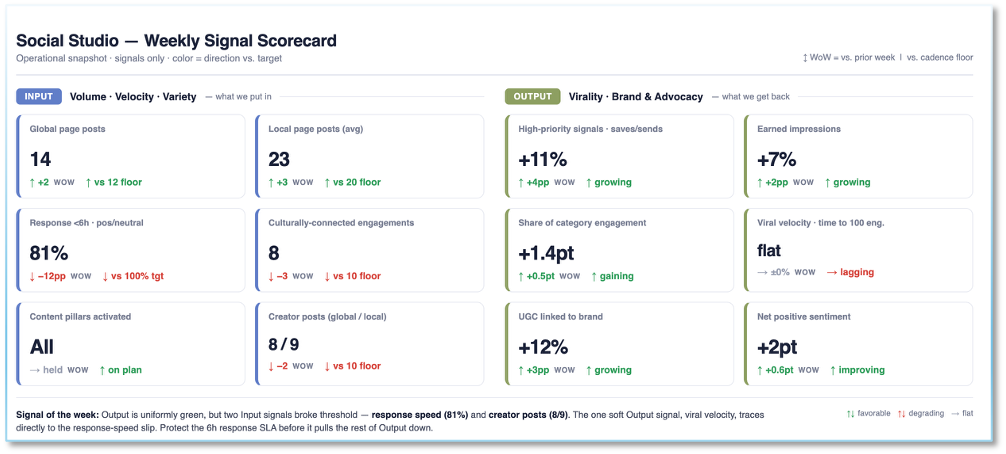
One easy detail to skip, and worth calling out: include operational metrics like platform utilization and feature-launch velocity in the scorecard too. They are the proof that the engine behind the program is actually running well, not just that the brand metrics look good on a slide.
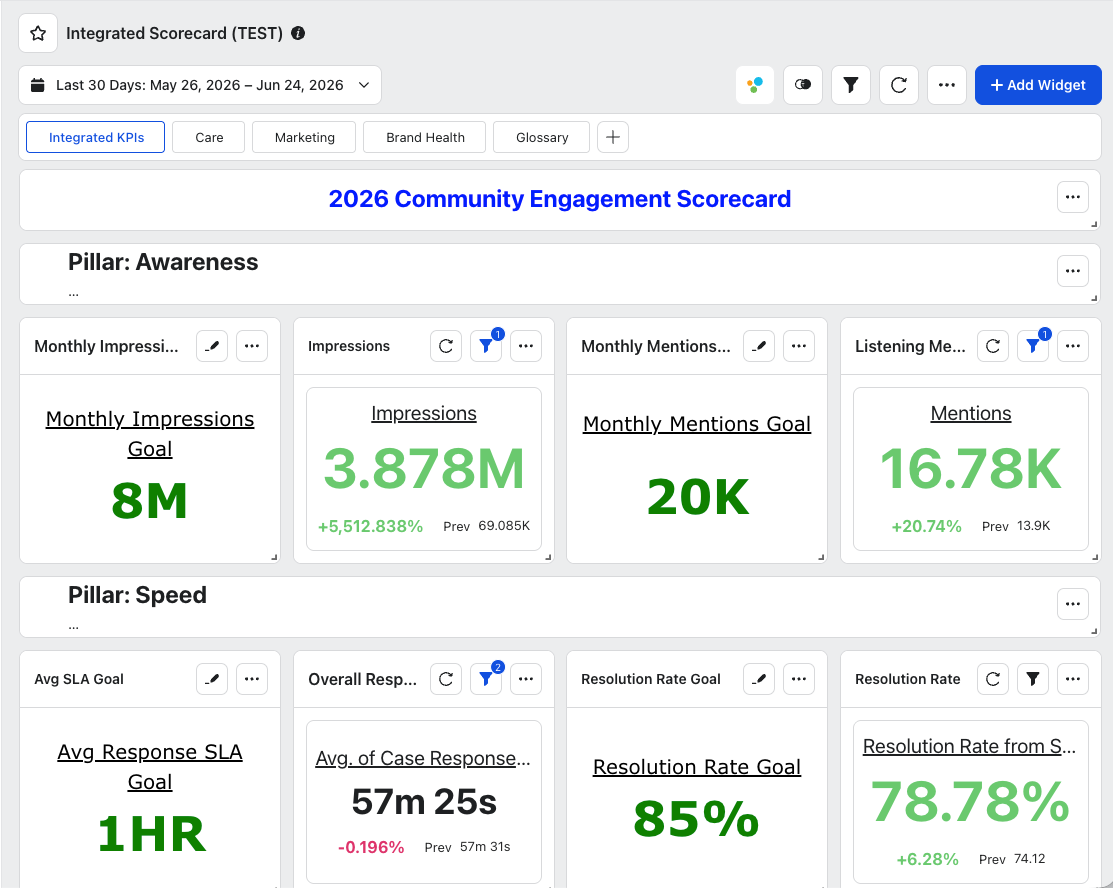
Inside Sprinklr, a shared scorecard can be built with a consistent layout: committed goals on the left, real-time actuals on the right, organized by pillar rather than by team or channel. That structural choice changes the conversation in the room, from "here's what my team did" to "here's where we're on track, and here's where we course-correct together." Outside Sprinklr, the same scorecard can live in an executive deck or a regularly presented dashboard, ideally owned by a cross-functional council that meets on a fixed cadence. That council, backed by a strong operating model, is what turns a scorecard into a genuine center of excellence, and what earns social a permanent seat at executive reviews instead of an occasional mention.
Premium Blend closed the session with four questions worth running for any stakeholder in your organization who should be getting Sprinklr insight but currently is not:
If your Sprinklr program is generating plenty of data but not enough action, the gap is rarely the platform. It is usually steps one through four of the dashboard-to-decision chain: audience, decision, signal, and story. Get those right, and format and distribution become much easier problems to solve.